
There’s no question that the US Swimming Olympic Trials is one of the most exciting swim meets on the planet. The depth of talent, and the fierce competition between truly world class swimmers is staggering. Add to that the heartbreak of watching previous champions miss the team, and the sheer joy of watching new Olympians being made. It’s a meet like no other.
But behind all this excitement and emotion there’s the real question of the strength of the 2016 Olympic Team. Will they do as well as their stellar performance of 2012? And how will they fare against a truly impressing looking Australian team.
There are many ways of determining strength. Given our obsession with Gold, it’s a fairly easy job of just counting up the top ranked country in each Olympic event to come up with a simple prediction of Olympic Gold. And here it is.
If this data is at all accurate, then it looks like Australia will run away with the gold medals in this Olympics. Their 9 #1 rankings is more than twice the 4 for the US. Hungary also has 4, while Japan has 3.
But we all know that this method is far too simplistic. Winning a gold involves far more than being the top seed. There are many top swimmers who will only carry out their full taper for the Olympics, as they know they don’t have to give it 100% for their national trials.
So the next idea is to broaden the search to the Top 5 in each event. While this is still no guarantee that we’ve captured the top swimmers, at least we have a larger number of data points to work with. And to make things more interesting, I compared the Top 5 going into the 2016 Olympics with the Top 5 going into the 2012 Olympics. (See the Note at the bottom of my post for my unorthodox way of estimating the 2012 data.)
Here’s where it gets interesting.
Notice that the US women have declined significantly in Top 5 rankings compared to 2012, and yet they remain a strong team. However, they now have one fewer Top 5 ranking than the Australians, despite having twice the Aussie count before the 2012 Olympics. By all appearances, the Women’s races will largely be a competition between Australia and the US, with Hungary a distant third.
The US men’s side is a completely different story. While they were far ahead of all other countries in 2012, they are even farther ahead of them in 2016. In fact, the US men with 19 Top 5 rankings have more than Japan and Australia combined, with both of them having 8 each. This data suggests that it will primarily be Japan and Australia fighting for the remaining medals.
My next step was to do a direct comparison between the 2012 and 2016 US teams, and specifically to compare winning times in each event.
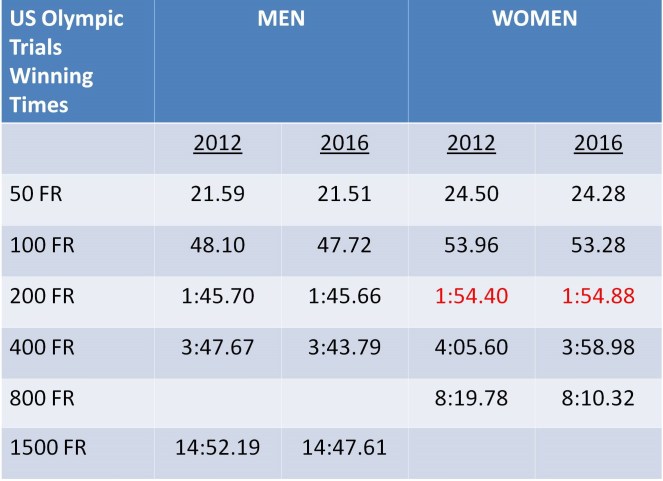
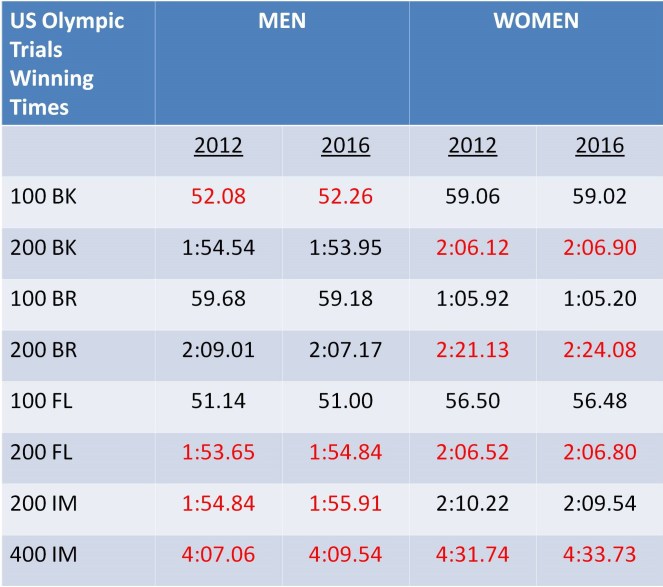
You can see here that there are 4 men’s events and 5 women’s events (numbers in red) where the 2012 Olympic Trials winning time was faster than the 2016 winning time. I don’t have historical data on this, but I strongly suspect that for a sport that generally achieves faster times year after year, this is surprising.
I then came up with a novel way of calculating a single value to determine the speed of the Trials for each gender. I took the 100 time for each event (double the 50 winning time, halve the 200 time, divide the 400 time by 4, etc) and then averaged those 13 times for each gender .

Here’s where the surprises start coming.
The winning times for the US men were only 0.11% faster in 2016 than 2012. That’s only 0.06 seconds per 100. In other words, the men are close to stagnating.
The numbers for the women are a little more encouraging. They have a 0.29% improvement since 2012.
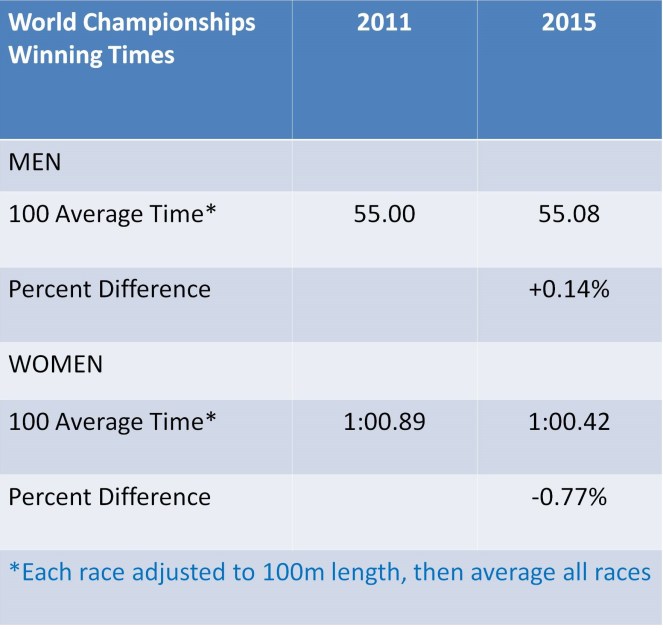
But the problem here is that this just looks at the US in isolation. So I then applied this technique to the 2011 and 2015 World Championship winning times, just to see how much World times were changing. NOTE: I only used Olympic events to generate the 100 Average value.
And here’s where we get a shocker.
The 2015 World Championship winning times for men were, on average, slower than 2011. By 0.14%. This makes the US Men’s Olympic Trials 2016 improvement of 0.11% now look much better than it did before.
The Women’s World times, however, improved by a massive 0.77%. And this means that the US Women’s Trials improvement of 0.29% has them falling behind the rest of the world.
Of course, none of these analyses really matter. All that counts is how people swim in that huge pressure cooker at the Olympics.
Other Random US Trials Observations
- Katie Ledecky in her 400 Free, and Michael Phelps in his 200 Fly seemed to be experimenting with Olympic race strategies. Both took it out much faster than they needed to in order to secure the Olympic spot. Katie was out in a blistering 1:56.28 with a foot touch, and came back in the second half of the race with a 2:02.70. Her 200 split alone would have been good for 3rd in the 200 finals, only 0.10 behind Missy Franklin. Meanwhile Phelps was out in 53.07 in his 200 Fly final, with a 2nd 100 of 61.77. Neither swimmer had to go out that hard, which leads me to think that they’re preparing their Olympic race strategy. Should be interesting to see if they go out that fast in the Olympics, and can then bring it back much faster.
- It was truly heartbreaking to watch Tyler Clary, Matt Grevers, Caitlin Leverenz and many many other big names miss the team. It’ll be interesting to see which ones continue for another 4 years, and which ones hang up their goggles.
- What a difference 4 years makes in the underwater portion of BR. If we remember back to the wild BR days of 2012, we saw Cameron van der Burgh win the 100 BR with at least 2 and possibly 3 underwater dolphin kicks. The Australians complained that van der Burgh should have been DQ’d and the gold go to Christian Sprenger, until underwater footage showed that Sprenger and pretty much all finalists did multiple dolphin kicks. Underwater footage at these Trials showed not even a hint of a second dolphin kick. I was very impressed by how still they kept their bodies after than first kick. This is a fantastic difference, and I sincerely hope the Olympics are kept as clean.
- I found it very surprising that there are no 18 and unders on this Olympic team. Apparently it’s been 116 years since that last happened. At every Olympic Trials it seems like some young phenomenon breaks out of almost nowhere to take on the world. 4 years ago it was 15-year old Katie Ledecky. However, despite this scarcity of teenagers on the team, there are still 28 first-time Olympians, versus 29 first-timers for the 2012 team. In other words, the makeup of this team is pretty similar to the last one.
- SwimSwam produced some fascinating data concerning the Trials. While it was largely invisible to TV viewers, only 18% of women’s races and 25% of men’s races were faster than their entry time. Also, 49% of women’s races and 55% of men’s races made the Trials qualifying times. While these results are only slightly worse than 2012, they probably deserve some detailed analysis by USA Swimming.
- Ryan Lochte has truly phenomenal underwaters, especially on the last turn of a race. But every time he pushed that last underwater really hard it looked like he paid a heavy price in the last 15 m of the race. Is it possible he was pushing the underwater too hard?
Overall, the US appears to be poised to win a considerable number of medals, with the men in a stronger position than the women. However, the lack of #1 rankings means the men will have to step up their game if they want those medals to be gold.
The US women appear to be weaker, relative to the rest of the world, than they were 4 years ago. Katie Ledecky aside, medals of any colour may be harder to obtain.
NOTE: I spent quite a while searching for accurate rankings immediately prior to the 2012 Olympics. I couldn’t even find the heat sheets or psych sheets for London, although many promising links turned out to be dead. However I did find Olympic race times that also gave the lane and heat. So I used standard circle seeding to identify the swimmers with the fastest 5 entry times.

Interesting stuff. I’d love to get you on my numbers programme around the Olympics.
Will Peaty win?
Sounds great Richard! I’d love that. Adam Peaty is the heavy favourite, and he has enough experience to come through when it counts. Let’s face it, someone will have to seriously elevate their game to make up that half second he has on the field.
Interesting. Thanks!
However, don’t you need to remove all USA winning times from your 2011 to 2015 World Championship analysis if you want to see how the rest of the World compares to the USA? Or, better yet – assuming there’s enough data points – calculate single values for USA vs the rest of the World for 2011 and 2015 for men and women, and do the analysis based on that?
As it is, you’re comparing World Championship meets (where the swimmers are expected to be fully tapered) to Olympic Trials (where some swimmers may not be fully tapered, as you already pointed out). So it’s a bit of apples to oranges.
Thanks Barry, You’re absolutely right in that its a bit of apples to oranges. But the idea was to determine the rate of World swimming improvement (and those numbers include the US winners at Worlds) over a 4-year period. And then see how the US has changed since the last Olympic Trials. Those numbers were quite illuminating. The real test of course will be how countries do at the Olympics, but a Trials analysis does provide a consistent and valid set of data.
Personally I’m still quite curious as to why the US chooses a short interim time before Olympics, but they seem to make it work very well for them. And we’ll never know whether thats the right choice.