
This is the next instalment in a series that looks at how the elite swim the 200 by looking at their race splits. This time we’re analyzing the 200 butterfly for women.
In the 200 freestyle and backstroke analyses (here, here and here) we found a number of surprises, or at least things that surprised me. While the top 24 swimmers generally displayed all three race profiles (Sprinter, Distance and Hybrid – see below), the individual races were won by either fast sprinters who got out ahead and couldn’t be caught (women’s freestyle and backstroke), or by more distance-oriented swimmers who ground out an incredible last 100 (men’s freestyle and backstroke).
Now that we’re starting to analyze the short axes strokes, it will be interesting to see if this pattern changes.
The Data
The data set consists of 24 elite swimmers at the time of the 2012 Olympics. I used the fastest 24 times from the Olympics and the US Olympic Trials. For each swimmer, I used the fastest time they swam during the competition, and not just their last swim. I also knew that I would have to look at more than just raw splits, in order to compare sprinters to more distance-oriented swimmers, and to provide value to non-elite swimmers. As a result, I used their 50 m Personal Bests [PBs] as well. For a few swimmers for which the 50 PB was unavailable or absurdly old, I either had to infer their 50 PB from their split on a 100, or else exclude them from the analysis.
I introduce the term “offset” to mean a split minus that swimmer’s PB.
Offset 50 = 50 Split minus 50 PB
The Analysis
The analysis is divided into 3 sections.
1) What are the different ways in which the elite 24 swimmers swim the 200? For long axis strokes, it’s more or less divided into those swimmers who are sprint-oriented, endurance-oriented, and in-between. We don’t yet know how this works for the 200 butterfly.
2) How do the top 8 swim the race differently than the other elite 16? And how does the winner swim differently than the rest?
3) Ways in which we can use this data when dealing with our own non-elite swimmers
Race Profiles
In these analyses I refer to race profiles. These profiles describe the pattern of the swimmer’s 50 splits. It’s important to remember that if a swimmer held a constant speed throughout the race, the 1st 50 would be the fastest because of the start (worth roughly 1.5 seconds), and all 50 would have identical splits, as each would include the turn and 50 m of swimming. This is unlike the long axis strokes where the last 50 split would not include the turn. For that reason, the race profile for short axis strokes should have a slower last length when compared to long axis strokes.
For the long axes strokes, I’ve defined the race profiles as follows: a Sprinter Profile is one in which each split is slower than the one before; a Hybrid Profile is one in which the 4th 50 is roughly the same as the 3rd 50; and a Distance Profile is one in which the 4th 50 is noticeably faster than the 3rd 50.
However, long axes strokes are more efficient in the water than the short axes strokes, and we can anticipate that this will cause less fatigue and therefore affect the shape of the profiles. We’ll attempt to discover and define race profiles for short axes strokes in the analysis of the 200 breaststroke and butterfly.
Women’s 200 Butterfly Analysis
How do the Elite Swim the 200 Butterfly?
Here we are looking to determine the various race strategies of elite swimmers in the 200 butterfly. My usual tactic is to rank the swimmers in order of their 50 PB, and then put them into 3 groups of 8: Top, or fastest 8 PBs , Middle, or next fastest 8, and Bottom, or slowest 8 BPs. The theory is that the swimmers with the fastest PBs will swim the race as sprinters, while the swimmers with the slowest PBs will swim the race as distance grinders. But this is what happened when I graphed the results.
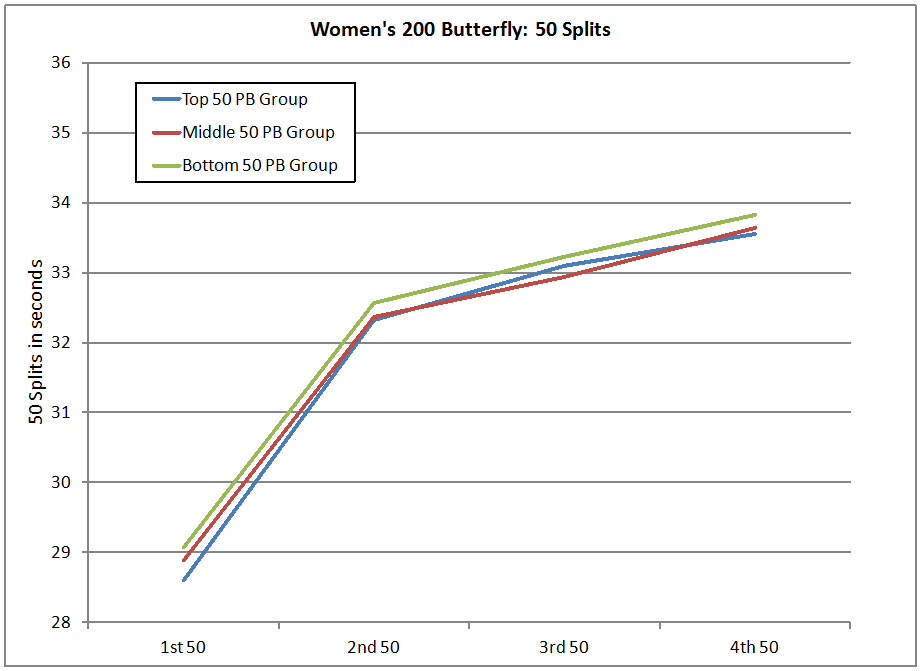

We can see from the graph and the table that despite significantly different PBs the average 50 splits are almost identical. Even the 200 Time averages of these 50 PB groups aren’t very different. This is very odd. The 50 PB should at least a mild indicator of how the race unfolds. So the next thing I looked at was how all 24 of the swimmers individually swam the race. And here’s the result.
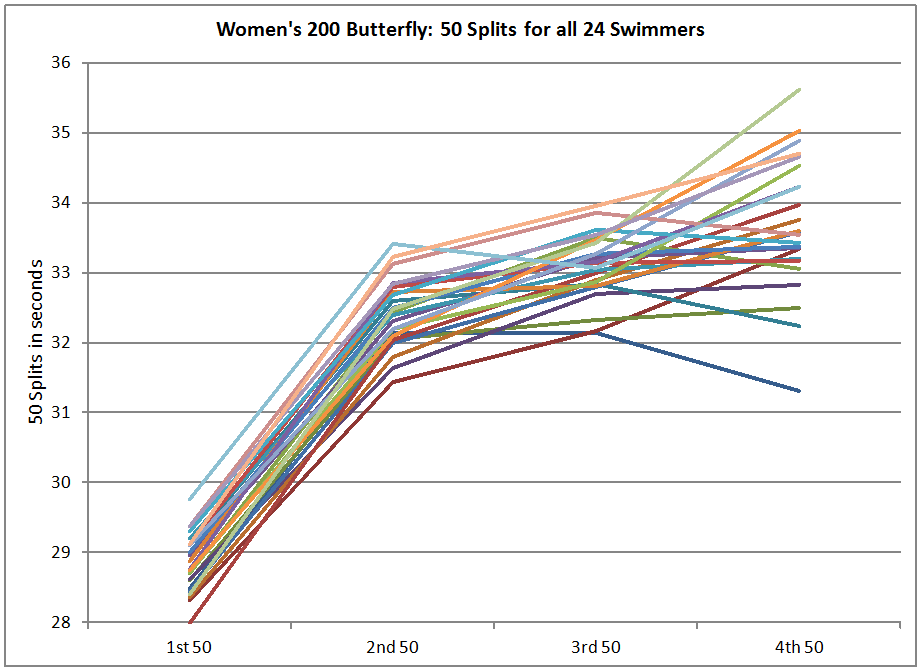
Surprisingly, with the exception of the top 3 finishers, the whole field swam the first 150 of the race in an almost identical fashion. And then the war began. Unfortunately, with everyone swimming the same basic profile to the 150 mark, the only way we can distinguish general race strategies involves the last 50.
So here we rank the swimmers on the basis of their 4th 50, and then put them into our Top, Middle and Bottom groups of 8. Here’s the result.
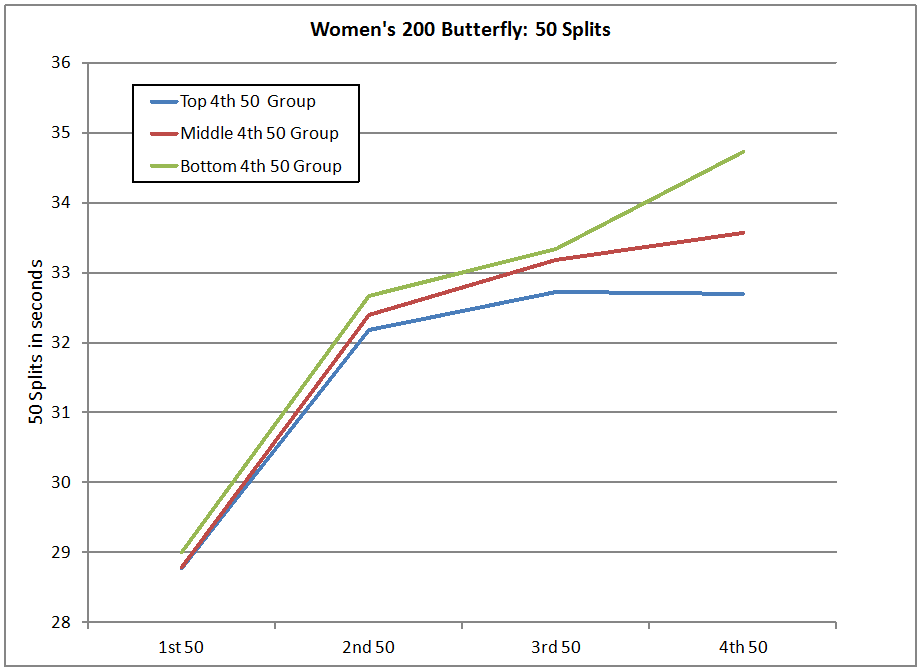
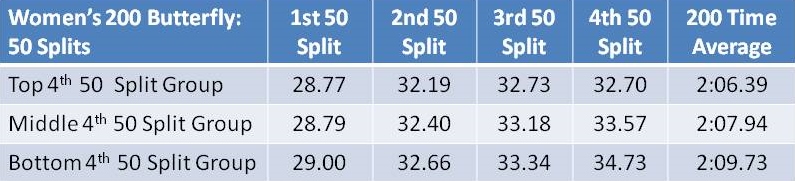
Now, we have some tentative profiles to work with. The graph and table show some separation between the Top, Middle and Bottom groups for each split, and for the 200 Time averages.
This elite field is best characterized as having similar profiles for the first 150, where the 2nd 50 is roughly 3.5 seconds slower than the first 50, and the 3rd 50 is roughly 0.7 seconds slower than the second 50. The 4th 50 is the wild west, and is where the best separate themselves.
Why are Best Better Than the Rest?
We’re next going to look at the what the top 8 are doing that makes them better than the other 16 elite swimmers. The best way to do this is to try to identify some specific aspect of the race that the top 8 do differently than the rest. Examples of this aspect could be their 50 PB, 1st 50 split, last 50 split, etc. And to measure the impact of this specific aspect, we’ll group the 24 swimmers into 3 groups of 8 according to this aspect, determine the average 200 time for the Top group, and then compare this Top group 200 average to the 200 time average of the top 8 200 times. The smaller the difference between the two averages, the more important that aspect of race.
The table below shows the results.

From what we saw above, we already knew that the 50 PB was not a good indicator of success. Interesting, each of the 50 splits on their own make for good indicators, meaning that while everyone started with the same basic profile, the swimmers with the fastest 200 times generally had the fastest splits at every step of the way, even if by only a small amount.
As it turns out the 4th 50 split is the best indicator, as the Middle and Bottom 4th 50 Split groups most closely match up to the Middle and Bottom 200 times. And as the graph indicates, the differentiator between the Top 8 and the other 16 elite swimmers is simply how fast they can swim the last 50.
Now we’ll drill down a bit deeper and try to figure out why Jiao Liuyang is the best of the best. For reference purposes, the fastest 8 were also the Olympic finalists. This first graph shows the raw 50 splits for the top 8 swimmers.

When we just look at the last 50 of the top 8, we can see 4 with definitely decaying speed profile, 2 with only a slight slowing, and two with substantially faster last 50s. The two with faster last 50s were Liuyang, and eventual Olympic 5th place finisher Cammile Adams. Adams went into that last 50 in 8th place, more than 2 seconds behind the next closest person, so perhaps she was saving her energy for that last 50.
Given that it’s a race that is so physically demanding, it’s not surprising that there are some pretty serious problems on the last 50. However, it’s astonishing that Liuyang easily wins the race with a blistering last 50 split of 31.31: a time so fast that it beats the 2nd, 3rd and 4th 50 splits of all 24 swimmers in our data set. Her last 50 is over 2 seconds faster than the last 50 of silver medallist, Mireia Belmonte Garcia. The story gets even more interesting when we realize that Jiao Liuyang is a silver medallist in the 50 m butterfly from the World Short Course Championships held in December, 2012. She obviously has the speed to swim that last 50 so quickly; it’s just astonishing that a sprinter that fast has the endurance to do so at the end of the race. Especially when she also had the fastest 3rd 50 out of all 24 swimmers as well.
For a possible explanation as to how Liuyang can do this, we’ll next look at the Offsets for those same 8 swimmers.
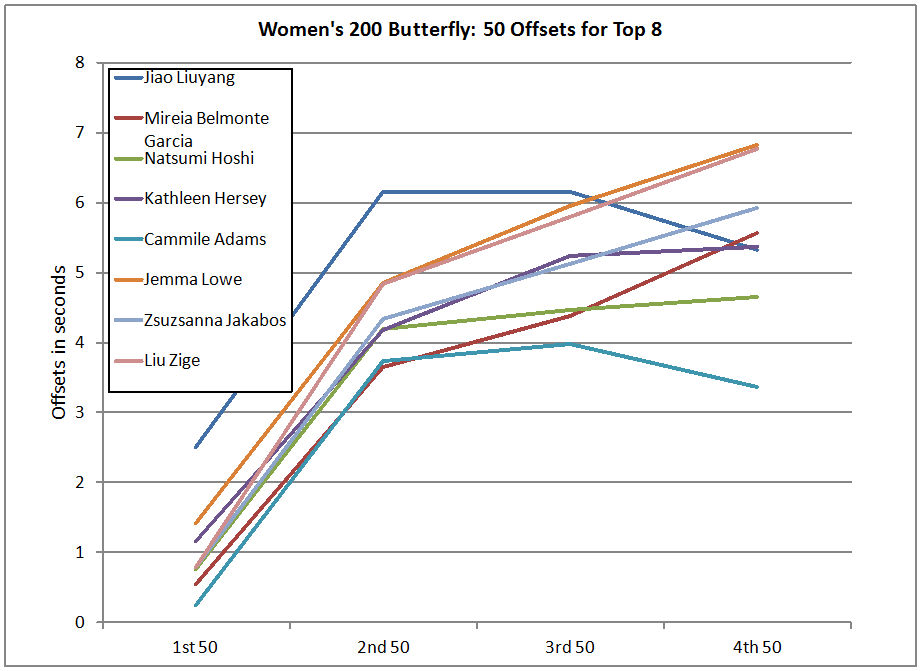
Liuyang’s incredibly fast 50 speed (25.23 SCM) actually means that she can swim her splits far above her PB, and still be very competitive. She takes out the first two 50s with offsets more than a second higher than the next highest offset, and then follows with the fastest 3rd 50 of the field, and yet with an offset higher than anyone else in the finals. Even her astonishing last 50 was achieved with an offset that was only the third highest in the final.
Ways in Which We Can Use This Data
Normally, this section would provide two methods for non-elite swimmers to make use of the data above. However, with this particular race, I don’t see how this is possible. When the vast majority of the 24 elite swimmers raced the first 150 in very similar fashion, all sense of race strategies seem to be thrown away. It mainly comes down to how fast you can swim that last 50, and this doesn’t lead to developing useful splits for slower swimmers. In fact, it doesn’t even lead to developing useful splits for elite swimmers.
Summary
The vast majority of the elite women swim the 200 butterfly with a strange similarity. The race profiles are almost identical until the last 50, when a very few were able to swim faster, and everyone slowed by varying amounts. As a result, its hard to say what differentiates the elite women from the rest, other than being able to swim this race profile for 150 and still not slow down too badly.
The top 8 are differentiated by their ability to swim the middle 100 slightly faster than the rest, and then swim the is last 50 quite a bit faster. The Olympic champion, Jiao Liuyang , used her incredible top-end speed to cruise through the first 100 quickly, and then swim the fastest 3rd 50 of the 24 elite swimmers, followed by a truly astounding last 50.
Next post: Men’s 200 Butterfly
