
It’s the men’s turn this time. Last week we looked at the 200 IM for women, and determined that it was slightly more oriented towards distance than sprinting, all seem to have strong butterfly splits and much wider split variations for the other 3 strokes, and the fastest tended to have the fastest freestyle splits. Now we’ll see how the men fare.
The 200 IM is a little more difficult to figure out than stroke 200s, as any combination of stroke strengths can combine to form a 200 IM. It’s pretty much a given that you can’t be an elite backstroker without being a strong backstroker.
That aside, I’ve come up with a way to look at the numbers, which brings us to this blog.
The Data
The data set consists of 24 elite swimmers at the time of the 2012 Olympics. I used the fastest 24 times and associated splits from the Olympics and the US Olympic Trials. For each swimmer, I used the fastest time they swam during the competition, and not just their last swim.
I also wanted a way to determine if the swimmer was sprint oriented or distance oriented, or in-between. So I added some analysis by gathering each swimmer’s 50 Free LC PB, 200 Free LC PB and 400 IM LC PB. These are swims that the vast majority of the elite 24 had. I was able to collect or estimate all of the 50 Free PBs, since most of these swimmers either swam a 50, 100 or relay 100 at a big meet in 2012 or 2011. Every selected swimmer has a 200 Free PB individually or on a relay. Interestingly, I had the most problems with the 400 IM. Six of the 200 IM elite 24 had no record of a 400 IM from 2010 to 2012. For these swimmers, I assumed that they were not particularly good at that distance, and so I gave them times that would put them in with the slowest of the 400 IM times.
The Analysis
The analysis is divided into 3 sections.
1) To determine which of the 50 Free, 200 Free and 400 IM events are the best indicator of success in the 200 IM. This will give an indication if the 200 IM is more sprint oriented, distance oriented, or in between.
2) Determine any common stroke strengths among these elite 24, and determine which strokes have the largest variations in splits (implying that some of the elite 24 are not as proficient in these strokes).
3) Determine how the top 8 differ from the other 16, and determine how the winner differs from everyone else.
I use a particular analytical correlation technique to help determine how closely one set of data is to another. It’s easiest to explain with an example of 50 Freestyle PBs.
I rank the elite 24 swimmers in groups of 8 (top, middle and bottom groups) according to their 200 IM times, and then average the times for each group. This forms the base data set. Then I group the elite 24 according to some other criteria, such as 50 Freestyle PBs in the same way (top, middle and bottom groups of 8), and average the 200 IM times for those group. I then compare the two sets of average 200 IM times to see how similar they are. The more similar, the lower the correlation number.
How do the Elite Men Swim the 200 Individual Medley?
The first step here is to determine whether the 200 IM elite 24 are more sprint-oriented, more distance oriented, or firmly in between as hybrid swimmers. To this end, I found the 50 Free PBs (sprint), 200 Free PBs (hybrid) and 400 IM PBs (distance) for each swimmer. I then developed correlation numbers for each of these cases.
The idea is that if the 200 IM is more of a sprint, then 50 Free PB will have the smallest correlation number. If its more of a distance event, then the 400 IM PB will have the smallest number. If its roughly half and half, then both correlation numbers should be similar.
The results are here.

Here we see that the 400 IM PB is an excellent indicator of success within the elite 24, with the smallest correlation number by quite a bit. This firmly puts the 200 IM as favouring distance over sprint. What’s surprising is how good the correlation is for the men, and yet how poor the 400 IM PB correlation number is for the women. In fact, 6 of the elite 24 women in 200 IM didn’t all even have a registered 400 IM PB. Interestingly, all three PBs for men have significantly better correlation with success in the 200 IM than any of these PBs are for the women.
What this tells us is that the best 200 IM men are not only better than the other elite 24 in the 200 IM (obviously), but have a very strong tendency to be better than the others in 400 IM, a strong tendency to be better than the others in the 200 Freestyle, and a reasonable chance of being better than the others in the 50 Freestyle. It sounds like, at least for the men, that the 200 IM is an excellent all round indication of swimming ability. That definitely cannot be said for the women.
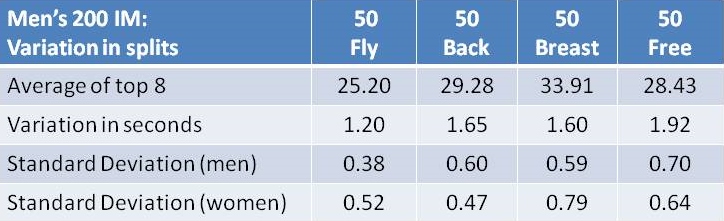
Next we’ll look at the individual strokes. As we know, the 200 IM involves all 4 strokes, and therefore attracts virtually every combination of strengths and weaknesses in those 4 strokes. Our first analysis here is to determine if there are any consistently strong strokes across the elite 24, or any strokes that include large variations in ability. To do this, I calculated the average, fastest and slowest splits for the 24 swimmers for each stroke, as well as the standard deviation.

As with the women, we can see that the butterfly splits are pretty tight, with a standard deviation only slightly higher than the women, but after that the similarities end. The men have much smaller standard deviations than the women on the other strokes, indicating that the worst strokes for men are more uniformly consistent and strong then the worst strokes for the women. In general, the elite 24 men have 4 strong strokes, with butterfly being a requirement.
Next we’ll look at the correlation of each 50 stroke split with the final 200 IM times to see if any strokes are more important than others. In general, the better the correlation, the more important that stroke is in the race.
Here are the results.
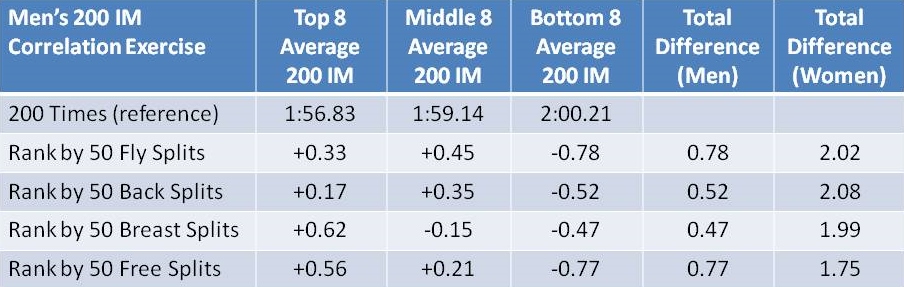
Again, we can see much better correlation with success for each stroke, than for any of the women’s strokes. This seems to tell us that the top 200 IM men tend to be better than the rest of the elite 24 at all 4 strokes. An interesting finding.
So what about the Top 8 200 IMers?
Let’s focus on the men with the fastest 8 times.
If we carry out the standard deviation for each 50 stroke for the top 8 just as we did for the elite 24, we find a similar picture. The 50 butterfly has a small range in splits, with only slightly larger for the other 3 strokes.
The range in splits is only slightly smaller than the women, showing that for the top 8, the men and women are similar in stroke strengths. The only real surprise is that the largest range for men is in the freestyle.
Now, let’s get down to how Michael Phelps won the race. Here’s a graph of the top 5 swimmers. I found that showing the raw splits didn’t really help point out the differences, so I did the following.
For each stroke I gave the swimmer with the fastest split an ‘offset split’ of 0.00 seconds. Each other swimmer then had an offset split equal to how much time over the fastest split they were. Doing this highlights who had the fastest splits and who had the slowest splits for each 50.

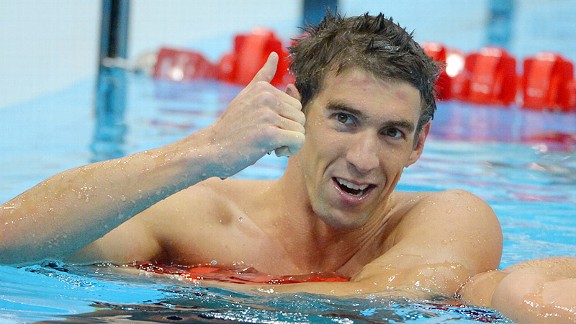
We can see with only a glance why Michael Phelps won that race. He started with the fastest fly, and then had the second fastest backstroke, breaststroke and freestyle splits. Ryan Lochte was not far behind, although we can see that the backstroke hurt his chances. No doubt his 200 backstroke final only 20 minutes before played a role here. Laszlo Cseh was all over the map, with the slowest backstroke of the 5, almost 1.5 seconds slower than Phelps, but then with the fastest breaststroke.
Summary
I think the top result in this is that the data implies that the 200 IM is the best indicator of all round swimming ability, but only for the men.
The elite field of men swim the 200 IM with far more distance emphasis than sprint emphasis. Interestingly, the top men tended to be better at 400 IM, 200 freestyle and 50 freestyle than the rest of the elite 24. Overall the field of 24 had much tighter split ranges for the four strokes than the women.
The fastest 8 are not just faster in the 200 IM than the rest of the elite 24, but are basically faster at all four strokes than the rest. Butterfly is a common strength, and freestyle had the largest split range, meaning it was probably the weakest. Finally, Michael Phelps won the 200 IM by being consistently at or near the top in each split.

Rick, years ago Bill Boomer did an analysis of the 200 IM by split percentages of the strokes to the overall time. Just taking your elite 8 those percentages come out to:
Fly ~22%(about what he came up with)
Bk – EXACTLY 25% (exact same)
Brst – EXACTLY 29% (a little bit faster, maybe 1%)
FR ~24%(a little slower, about 1%).
My observations, without any research, is that the best 200 IMers are out fast on fly and then go into an aggressive stroke rate/rhythm on back immediately which gives them momentum into Brst, and then the free is truly a “how tough are you going to be” length.
I enjoy these number analyses!
Hi Gordy,
I love that concept. I looked at the top four swimmers, since they show about as much variation as you’ll ever get in a 200 IM. Cseh with his relatively slow back and fast breast, Pereira with the fast back and slow free. I got the following:
Phelps – 21.6%, 25.1%, 29.2%, 24.2%
Lochte – 21.6%, 25.3%, 29.1%, 24.0%
Cseh – 21.5%, 25.7%, 28.5%, 24.3%
Pereira – 21.6%, 24.3%, 28.9%, 25.2%
So you’re bang on, with the general concept of high level 200 IMs.
But you had another comment that referred to data that I didn’t show.
I also correlated the 100s (first, middle, and last) with the 200 IM, and the best single indicator of success was the speed of the middle 100 (back and breast).
First 100: 0.80
Middle 100 0.36
Last 100 1.39
If we put all this together, there appears to be a requirement for a fast fly, and then the fastest 200 IMers clearly swim the fastest middle 100. Surprisingly, the correlation with last 50 freestyle is not as good. As you said, the freestyle is just “how tough are you going to be”. And the top ones are all tough!
Thanks for getting me to think in a new way.
i am a numbers freak sometimes and i took a ton of meets, all Olympics back to 1980, all world champs, along with many many other meets I can’t remember, it took me a month to work on, and for yards, some juniors, ncaas etc and developed %’s for every event SCY and LCM and my %’s for the IM were almost exactly these. 21.71% fly, 25.68 Back,, 29.10 breast, 23.51 for free. i have updated it after newer Olympics and check other meets against %’s and they are usually all within .05 of any part. really amazing. and then we can tell the kids the splits they need to finish with the time they want. the IM is the biggest variation like cseh has but it’s a great guide to help our kids!!
Thanks Oakman! Longitudinal data is always appreciated. I can imagine that things changed slightly when underwater became more prominent, but what amazes me is how close the percentages are for even the outliers. It really shows how elite IMers must have 4 very strong strokes, and then deviations are all small. I suspect we’ll see bigger differences when I get around to the 400 IMs. Not only do we now add a serious need for conditioning, but endurance PEDs will now play a much bigger role. Something tells me the outliers will be much MUCH more obvious.