

This is the next installment in a series that looks at how the elite swim the 200 by looking at their race splits. This time we’re analyzing the 200 breaststroke for men.
The first set of analyses involved the long axis strokes for men and women (here, here and here). We found clear indications of specific race profiles (Sprinter, Distance and Hybrid – see below) that made sense given the efficient nature of the strokes. The women’s freestyle and backstroke were won with Sprinter profiles, while the men’s races were won with Distance profiles.
I then looked at the 200 butterfly (here and here), and found a world of differences. Gone are anything approaching sprinter / distance profiles, and instead the races are handled by the elite in virtually the same say for the first 150, followed by a wild final 50. This significantly different race profile was verified with the analysis of the women’s 200 breaststroke (here).
It will be interesting to see if the 200 breaststroke for men follows this short axis race pattern.
The Data
The data set consists of 24 elite swimmers at the time of the 2012 Olympics. I used the fastest 24 times from the Olympics and the US Olympic Trials. For each swimmer, I used the fastest time they swam during the competition, and not just their last swim. I also knew that I would have to look at more than just raw splits, in order to compare sprinters to more distance-oriented swimmers, and to provide value to non-elite swimmers. As a result, I used their 50 m Personal Bests [PBs] as well. For a few swimmers for which the 50 PB was unavailable or absurdly old, I was able to infer a reasonable 50 PB from their split on a 100.
I introduce the term “offset” to mean a split minus that swimmer’s PB.
Offset 50 = 50 Split minus 50 PB
The Analysis
The analysis is divided into 3 sections.
1) What are the different ways in which the elite 24 swimmers swim the 200? For long axis strokes, it’s more or less divided into those swimmers who are sprint-oriented, endurance-oriented, and in-between. With this analysis we will attempt to determine how the elite men swim the 200 breaststroke.
2) How do the top 8 swim the race differently than the other elite 16? And how does the winner swim differently than the rest?
3) Ways in which we can use this data when dealing with our own non-elite swimmers
Race Profiles
In these analyses I refer to race profiles. These profiles describe the pattern of the swimmer’s 50 splits. It’s important to remember that if a swimmer held a constant speed throughout the race, the 1st 50 would be the fastest because of the start (worth roughly 1.5 seconds), and all 50 would have identical splits, as each would include the turn and 50 m of swimming. This is unlike the long axis strokes where the last 50 split would not include the turn. For that reason, the race profile for short axis strokes should have a slower last length when compared to long axis strokes.
For the long axes strokes, I’ve defined the race profiles as follows: a Sprinter Profile is one in which each split is slower than the one before; a Hybrid Profile is one in which the 4th 50 is roughly the same as the 3rd 50; and a Distance Profile is one in which the 4th 50 is noticeably faster than the 3rd 50.
For the 200 butterfly, however, the “shape” of the 50 splits for almost everybody was the same for the first 150 in a very similar fashion, and then a final 50 with whatever energy they had left. This resulted in those who died in the final 50 (Dying profile – last 50 slower than the 3rd 50 by 1 second or more), those who faded in the final 50 (Fading profile – those whose last 50 was 0 – 1.0 second slower than the 3rd 50) and those who finished the race faster (Finishing profile – last 50 faster than the 3rd 50). The 200 breaststroke for women was similar to the butterfly except that the first 100 was handled in a very similar fashion by everybody, with the last 100 being a little crazy.
How do the Elite Men Swim the 200 Breaststroke?
Here we are looking to determine the various race strategies of elite swimmers in the 200 breaststroke. My usual tactic is to rank the swimmers in order of their 50 PB, and then put them into 3 groups of 8: Top, or fastest 8 PBs , Middle, or next fastest 8, and Bottom, or slowest 8 BPs. The theory is that the swimmers with the fastest PBs will swim the race as sprinters, while the swimmers with the slowest PBs will swim the race as distance grinders. But this is what happened when I graphed the results. I’ve included the men’s butterfly results for comparison purposes.

First off we can see that despite significantly different 50 PBs for the Top, Middle and Bottom groups, on average each group in both races swam the race in a similar way. Everybody has similar first 50s, followed by a second 50 on average 3.5 seconds slower, a third 50 roughly 0.5 slower, and a last 50 another 0.5 seconds slower. The women’s races are quite similar as well. It’s clear for both races and both genders that the 50 PB is not an indicator of how the elite swim the short axis stroke 200s.
So the next thing I looked at was how all 24 of the swimmers individually swam the race. And here’s the result.
Here we can see that, despite different first 50s, the second 50 was roughly the same amount slower by each person. The third 50 has a little more variation, and then a 4th 50 where things start to explode. We can verify this by checking the standard deviation for each of the 50s. I’ve included all of the standard deviations for all of the 200s for comparison purposes. And I’ve also added a Totals column representing the total of the standard deviations for the four 50s.

The tables provide us with a big surprise. As we guessed, there is far less variation in the men’s race than the women’s race, but it turns out that the men’s 200 breaststroke has the least amount of variation of any of the 8 races. Adding the individual standard deviations from the 50s, the men’s breaststroke (1.83) barely beats out the men’s freestyle (1.84), while the women’s breaststroke (2.94) has the most variation of the 8 races.
The table also verifies that the 4th 50 is the one with the most variation, and therefore the best prospect for identifying different race profiles. This next graph shows our 24 swimmers ranked on the basis of their 4th 50, and then put them into our Top, Middle and Bottom groups of 8. Here are the results. I’ve included the men’s 200 butterfly results for comparison purposes.


Once again, we can see a remarkable similarity in how the races are handled, when we break it down by the 4th 50 splits. In both races the Top groups, who swam the last 50 the fastest, also swam the second and third 50s the fastest. We can also see the same distinct groups appear. All swim the first 100 in the same way relative to their 50 PB: 2nd 50 = 1st 50 + 3.5 seconds. For the breaststroke race, however, the Top group starts diverging from the rest on the third 50, slowing by only about 0.2 seconds , and another 0.3 for the last 50. The Middle and Bottom groups start falling off the pace. Overall, the drops are not as severe as with the 200 butterfly.
The elite field of 24 is best characterized as having similar race strategies for the first 100, and then splitting off into those whose last two 50 splits are up to 2 seconds above the 2nd 50 split (Dying profile), those whose last two 50 splits increase by only about 1 seconds (Fading profile), and those who can pretty much hold the pace through to the end of the race (Finishing profile).
Why are the Best Better Than the Rest?
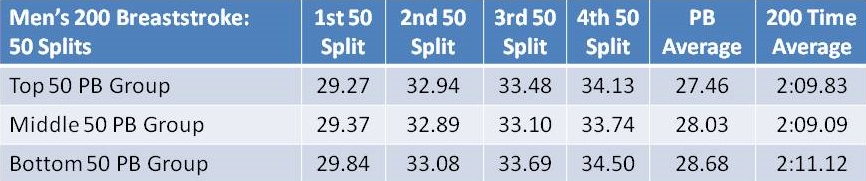
We’re next going to look at the what the top 8 are doing that makes them better than the other 16 elite swimmers. The best way to do this is to try to identify some specific aspect of the race that the top 8 do differently than the rest. Examples of this aspect could be their 50 PB, 1st 50 split, last 50 split, etc. And to measure the impact of this specific aspect, we’ll group the 24 swimmers into 3 groups of 8 according to the different aspects, determine the average 200 time for Top group and then compare it to 200 time average of the Top 8 200 times. The smaller the difference between the two averages, the more important that aspect of race.
The table below shows the results.

As we can see from this table, the 3rd 50 correlates the best with the final 200 times. That is, the 3rd 50 split by itself is the best indicator of how the 24 swimmers did on their final 200 time.

We can see here that, as we found above, the Top swimmers start separating themselves from the pack starting with a 3rd 50 that is, on average, the same split time as the 2nd 50, and then finishing with a faster last 50. In essence, the top 8 can swim the 2nd, 3rd and 4th 50s without any significant loss of speed.
Now we’ll drill down a bit deeper and try to figure out why Daniel Gyurta is the best of the best. For reference purposes, the fastest 8 were also the Olympic finalists. This first graph shows the raw 50 splits for the top 8 swimmers.
At first glance, it’s not obvious from this graph why Daniel Gyurta won. He didn’t really dominate any aspect of the race the way many of the other champions did. But a closer look shows that he was among the leaders at the 1st 50, and then really made his move on the 2nd 50. At this point he was still behind Kitajima, but then put up very solid 3rd and 4th 50s to win by 0.15 seconds over a fast charging Michael Jamieson. Jamieson had only the 4th fastest 3rd 50 split, but then put in a 4th 50 split that was 0.5 seconds faster than the next fastest. It’s possible that he could have won with a more aggressive 3rd 50.
It’s interesting to note that past champion, Kitajima, set a blazing pace pace in the first 50, over half a second ahead of the field. However, he couldn’t hold the pace and slowed dramatically, while still getting 4th. He probably came the closest to having a long axis Sprinter profile for his race.
It’s interesting to note that just like the women’s champion, Rebecca Soni, Gyurta also defied the profiles by making his move on the second 50 when everyone else was playing it safe in exactly the same way. There’s something to be said for not following the crowd.
A look at the 50 Offsets for these finalists is quite illuminating.

We see a pretty consistent grouping with these Offsets. Gyurta’s offsets are right with the pack, not showing any kind of heroics. Again, we see the advantage of having that top-end 50 speed, allowing the swimmer to swim each split in the 200 comfortably above the PB. The only major deviations from the pack are Kitajima with high offsets on the 2nd, 3rd and 4th 50s, and Jamieson with that blazing fast last 50.
Ways in Which We Can Use This Data
Normally, this section would provide two methods for non-elite swimmers to make use of the data above. However, as with the 200 butterfly, there doesn’t appear to be a lot of different strategies for the race. The basic idea seems to be to swim the first hundred exactly like everyone else, and then see what you have in the last 100. Sprinters and Distance swimmers alike swim the same race.
Summary
After analyzing the women’s 200 breaststroke and determining that it has the largest variations in splits of the 8 races looked at so far, it was a surprise to determine that the men’s 200 breaststroke has the least variation. The men’s 200 breaststroke race resembles the other short axis races in that the first part of the race is performed in a very similar fashion by almost everybody, regardless of their 50 PB or any other factor. For the butterfly the similarity reigned for the first 150, while for the breaststroke it only lasted the first 100. Specifically, the first 50 is done roughly 1.5 seconds above PB, and the second 50 about 5.0 seconds above PB. After that the race is finished with one of three profiles which are very similar to the butterfly profiles. A Dying profile (last two 50s at 1 and 2 seconds respectively above the 2nd 50), a Fading profile (last two 50s at up to 1 second above the 2nd 50) and a Finishing profile (last two 50s roughly equal or faster than the 2nd 50).
The top 8 are differentiated by their ability to swim the first 100 slightly faster than the rest, and the last 100 significantly faster than the rest. Of the top 8, only Kitajima was approaching a Dying profile. The rest were mainly Fading profiles. The Olympic champion, Daniel Gyurta swam a very controlled race, defying the profiles with a very strong second 50, and then holding pace to eke out the win.
Next post: 200 IM?

Thank you!