

This is the next instalment in a series that looks at how the elite swim the 200 by looking at their race splits. This time we’re analyzing the 200 breaststroke for women.
The first set of analyses involved the long axis strokes for men and women (here, here and here). We found clear indications of specific race profiles (Sprinter, Distance and Hybrid – see below) that made sense given the efficient nature of the strokes. The women’s freestyle and backstroke were won with Sprinter profiles, while the men’s races were won with Distance profiles.
I then looked at the 200 butterfly (here and here), and found a world of differences. Gone are anything approaching sprinter / distance profiles, and instead the races are handled by the elite in virtually the same say for the first 150, followed by a wild final 50.
It will be interesting to see if the 200 breaststroke follows the butterfly pattern.
The Data
The data set consists of 24 elite swimmers at the time of the 2012 Olympics. I used the fastest 24 times from the Olympics and the US Olympic Trials. For each swimmer, I used the fastest time they swam during the competition, and not just their last swim. I also knew that I would have to look at more than just raw splits, in order to compare sprinters to more distance-oriented swimmers, and to provide value to non-elite swimmers. As a result, I used their 50 m Personal Bests [PBs] as well. For a few swimmers for which the 50 PB was unavailable or absurdly old, I was able to infer a reasonable 50 PB from their split on a 100.
I introduce the term “offset” to mean a split minus that swimmer’s PB.
Offset 50 = 50 Split minus 50 PB
The Analysis
The analysis is divided into 3 sections.
1) What are the different ways in which the elite 24 swimmers swim the 200? For long axis strokes, it’s more or less divided into those swimmers who are sprint-oriented, endurance-oriented, and in-between. With this analysis we will attempt to determine how the elite swim the 200 breaststroke.
2) How do the top 8 swim the race differently than the other elite 16? And how does the winner swim differently than the rest?
3) Ways in which we can use this data when dealing with our own non-elite swimmers
Race Profiles
In these analyses I refer to race profiles. These profiles describe the pattern of the swimmer’s 50 splits. It’s important to remember that if a swimmer held a constant speed throughout the race, the 1st 50 would be the fastest because of the start (worth roughly 1.5 seconds), and all 50 would have identical splits, as each would include the turn and 50 m of swimming. This is unlike the long axis strokes where the last 50 split would not include the turn. For that reason, the race profile for short axis strokes should have a slower last length when compared to long axis strokes.
For the long axes strokes, I’ve defined the race profiles as follows: a Sprinter Profile is one in which each split is slower than the one before; a Hybrid Profile is one in which the 4th 50 is roughly the same as the 3rd 50; and a Distance Profile is one in which the 4th 50 is noticeably faster than the 3rd 50.
For the 200 butterfly, however, the “shape” of the 50 splits for almost everybody was the same for the first 150 in a very similar fashion, and then a final 50 with whatever energy they had left. This resulted in those who died in the final 50 (Dying profile – last 50 slower than the 3rd 50 by 1 second or more), those who faded in the final 50 (Fading profile – those whose last 50 was 0 – 1.0 second slower than the 3rd 50) and those who finished the race faster (Finishing profile – last 50 faster than the 3rd 50)
How do the Elite Women Swim the 200 Breaststroke?
Here we are looking to determine the various race strategies of elite swimmers in the 200 breaststroke. My usual tactic is to rank the swimmers in order of their 50 PB, and then put them into 3 groups of 8: Top, or fastest 8 PBs , Middle, or next fastest 8, and Bottom, or slowest 8 BPs. The theory is that the swimmers with the fastest PBs will swim the race as sprinters, while the swimmers with the slowest PBs will swim the race as distance grinders. But this is what happened when I graphed the results.

We can see from the graph and the table that despite significantly different 50 PBs, on average each group swam the race in an identical way. Similar first 50s, followed by a second 50 on average 3.5 seconds slower, a third 50 a further 0.4 seconds slower, and a last 50 another 0.5 seconds slower. It’s clear that the 50 PB is not an indicator of how the elite swim the race.
So the next thing I looked at was how all 24 of the swimmers individually swam the race. And here’s the result.
We can see similarity in the first two 50s, and then a lot of variation in the third 50. The fourth 50 is where it all blows up. As with the 200 butterfly, it looks like the 4th 50 is the one that has the greatest variation in split times. We can verify this by checking the standard deviation for each of the 50s. I’ve included the standard deviations for the other women’s 200 races for comparison purposes.

The table verifies that the 4th 50 has the greatest variation in splits. But what’s surprising is that this variation (std dev. = 1.1) is far greater than for any 50 in the 200 freestyle, backstroke or butterfly. In other words, the last 50 of the women’s 200 breaststroke is the wildest 50 of any of the 200s. And that’s after a pretty wild 3rd 50.
This leads us to rank the swimmers on the basis of their 4th 50, and then put them into our Top, Middle and Bottom groups of 8. I’ve included both the display of 50 splits and 50 Offsets Here are the results.

While the 50 splits definitely shows a difference in race strategies, the 50 Offsets highlights it even further. We can see here that there are three distinct groups, with all swimming the first 100 in the same way relative to their 50 PB: 1s5 50 = PB + 1.5 and 2nd 50 = 5. Then the groups branch off with the Top group swimming the 3rd and 4th 50s roughly the same as the 2nd 50 at 5 seconds above PB, the Middle group swimming the 3rd and 4th 50s roughly 5.5 seconds above PB, and the Bottom group dying off to almost 6 seconds and then 7 seconds above PB. This is similar to the butterfly profiles, except that the breaststroke profiles diverged on the 3rd 50, while the butterfly profiles diverged in a significant way only on the 4th 50.
The elite field is best characterized as having similar race strategies for the first 100, and then splitting off into those who slow significantly (Dying profile), those who slow slightly (Fading profile), and those who can hold the pace till the end of the race (Finishing profile).
Why are Best Better Than the Rest?
We’re next going to look at the what the top 8 are doing that makes them better than the other 16 elite swimmers. The best way to do this is to try to identify some specific aspect of the race that the top 8 do differently than the rest. Examples of this aspect could be their 50 PB, 1st 50 split, last 50 split, etc. And to measure the impact of this specific aspect, we’ll group the 24 swimmers into 3 groups of 8 according to the different aspects, determine the average 200 time for Top group and then compare it to 200 time average of the Top 8 200 times. The smaller the difference between the two averages, the more important that aspect of race.
The table below shows the results.
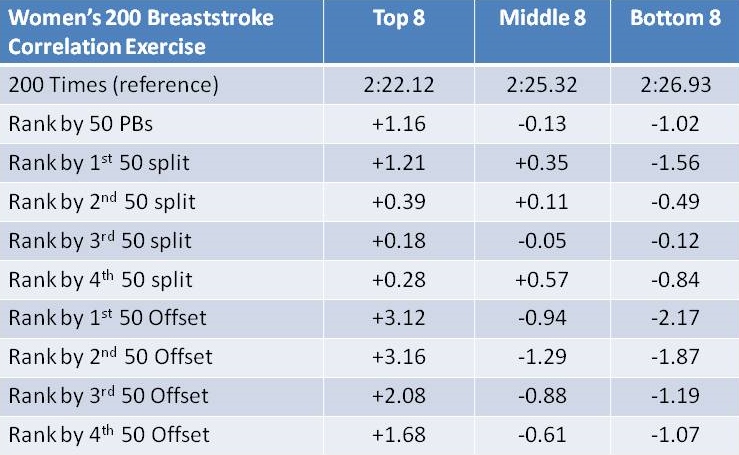
From what we saw above, we already knew that the 50 PB was not a good indicator of success. The table also shows us that the 1st 50 is not a good indicator as well, while the 3rd 50 is the best indicator of Top, Middle and Bottom groups by quite a margin. This means that the 3rd 50 split on its own is the best indicator of how the 24 swimmers did in their 200.

We can see here that the thing that generally distinguishes the top 8 from the rest is their strategy / ability to swim the 2nd, 3rd and 4th 50s without a significant loss of speed.
Now we’ll drill down a bit deeper and try to figure out why Rebecca Soni is the best of the best. For reference purposes, the fastest 8 were also the Olympic finalists. This first graph shows the raw 50 splits for the top 8 swimmers.
When we just look at the 50 splits for the top 8, we can see a mishmash of results, but each finalist generally having the last three 50s with roughly the same split time. In fact, we can clearly see the 8 split into two groups of 4 after the 2nd 50. The 4 that fell behind, never caught up. Among these 8 finalists, we can see 3 with a Finishing profile (last 50 same or slightly faster than 3rd 50) and 5 with a Fading profile (last 50 slightly slower than 3rd 50). The 3 medalists all had Finishing profiles.
The graph also shows us that gold medalist Rebecca Soni defied the profiles with an aggressive 2nd 50 while opening up a half second lead. She was then able to repeat her 2nd 50 split two more times to win handily. Suzuki went with the crowd on the first two 50s and then repeated her 2nd 50 split two more times to get the silver. Bronze Medalist Efimova did the first 50 at the tail end of the group of 8, and was still in 7th place at the 100 mark before unleashing a furious last 100 to almost catch Suzuki. The splits would suggest Efimova wasn’t aggressive enough at the start of the race, especially considering she has the fastest 50 PB out of all 24 swimmers.
A look at the 50 Offsets for these finalists is quite illuminating.

Soni’s offsets shows that she swam well in control during the whole race, no doubt aided by the 2nd fastest 50 PB out of the 24 elite swimmers. In fact, her 2nd, 3rd and 4th 50 Offsets were all over 5 seconds. In contrast, Efimova with a faster 50 PB is seen taking it out much easier (in terms of time over her PB), having the highest offsets of the finalists for the first three 50s.
Rebecca Soni was able to use her fast 50 PB speed to swim an aggressive front end of the race without getting too close to her PB, and then swimming a controlled back end of the race to win handily.
Ways in Which We Can Use This Data
Normally, this section would provide two methods for non-elite swimmers to make use of the data above. However, as with the 200 butterfly, there doesn’t appear to be a lot of different strategies for the race. The basic idea seems to be to swim the first hundred exactly like everyone else, and then see what you have in the last 100.
Summary
The women’s 200 breaststroke resembles the 200 butterfly in that the first part of the race is performed pretty much the same by everybody, regardless of their 50 PB or anything else. For the butterfly, the similarity lasted for the first 150, while for the breaststroke it only lasted the first 100. Specifically, the first 50 is done roughly 1.5 seconds above PB, and the second 50 about 5.0 seconds above PB. After that the race is finished with one of three profiles which are very similar to the butterfly profiles. A Dying profile (last two 50s at 1 second or more above the 2nd 50), a Fading profile (last two 50s at roughly 0.5 seconds above the 2nd 50) and a Finishing profile (last two 50s roughly equal or faster than the 2nd 50).
The top 8 are differentiated by their ability to swim the first 100 slightly faster than the rest, and the last 100 significantly faster than the rest. None of the top 8 used a Dying profile. The Olympic champion, Rebecca Soni, used her impressive top-end speed to aggressively grab a lead in the first 100, and then swim evenly through the last 100 and win easily. Once again, top end speed wins the day in the 200.

its great, though can you made one with lap 1 la2 lap3 … for the 200 breast stratigyes