


It’s been a little while since I’ve done a Swimming By the Numbers blog post, and the recent Canadian Olympic Trials sparked an idea. We had incredibly strong performances from the women, and NOT incredibly strong performances from the men. A lot of theories were thrown around, one being that we are abandoning our older swimmers (not named to an international games team even if they win the trials, and reducing funding for those swimmers) when we feel they’re too old to perform at the top level on the international scene. And yet men peak later than women, so perhaps we’re giving up on them too soon.
As I said, even though it was a popular theory, it was just a theory.
So I decided to analyze the ages of Olympic Trials swimmers from different countries just to see where the data lead me.
I decided NOT to only use the ages of those who made their country’s Olympic teams, mainly because the sample size is much too small. The stats could easily be influenced by individual outlying athletes. Instead I looked at medalists and finalists in each Olympic event at the Trials. (My favourite example of that type of problem is when Zimbabwe was ranked as the 8th best swimming country at the 2008 Olympics, all due the incredible Kirsty Coventry and her individual gold and 3 silvers. This put Zimbabwe ahead of France, Russia, Italy, Brazil, Canada, etc.)
I picked 6 countries to work with, all of whom had their Olympic Trials right around April. These were Canada, Australia, Britain, Japan, Russia and Brazil. I would have included China, but it was much too hard to get the Trials results. Unfortunately, this excludes the US, who inexplicably hold their trials very close to the Olympics.
The Analysis
These first 2 graphs show the average ages of medalists and finalists for each of the six countries.

We can see right away that Canada, Australia and Japan have remarkably similar average ages, and Britain is close with slightly older medalists. Russia really sticks out with a remarkably young field of finalists and medalists. Without knowing anything about their system, it really looks like they’ve started over with their women. And Brazil is remarkable with the much older average ages. Again, without knowing anything about their system, it strikes me that they are probably supporting their top swimmers no matter what age they are.
Also, notice that medalists tend to be older than finalists, other than a small dip with the Japanese numbers.

The picture on the men’s side is quite a bit different. No one country is like any other country. Indeed, Canadian men have the youngest average age for both finalists and medalists, with the finalists being a full year younger than the average ages of any of the other 6 countries. There could be something to this theory I mentioned at the top.
Brazilian men, as with their women, again have the oldest average ages. And for all 6 countries, the average age of medalists is significantly above that of finalists.
Average ages is just one way of looking at the data. It really doesn’t tell us how much variation in ages we have in the population. I can only assume that a wide variation is preferred, as that type of age diversity is generally preferential in any natural population of humans or animals. You want the young guns to be blazing away and challenging, and you want the older ones to be in there fighting for as long as they can.
The US would be a great example of this. They have so many young stars making names for themselves (Katie Ledecky, Michael Andrew, Whitley Reese to just name a few) along with much older stars (Dara Torres, Michael Phelps, Nathan Adrian, Natalie Coughlin).
In order to address this issue I calculated the median and standard deviation for each of these countries.
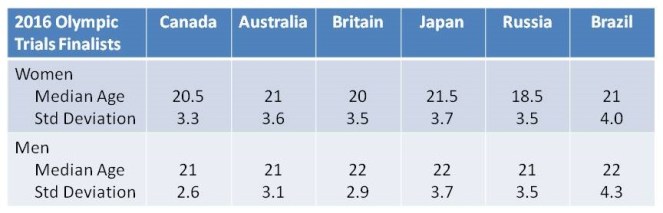
What’s remarkable about this data is the incredible consistency of the median age of finalists. Other than Russia, the spread on the other 5 countries is from 20.0 to 21.5. And for the men, it’s from 21 to 22.
It’s the standard deviation, however, where we get the interesting information. Canada is on the low end for both women and men. But while the Canadian women are right in the mix with 3.3 (8% below the 6-country average of 3.60), the men are considerably lower. Their 2.6 is a full 22% lower. In other words, the age variation among Olympic Trial finalists is significantly less than any other country. If age variation is perferred, then this is a worrisome situation for Canada.
Brazil ranked highest for both genders for standard deviation. The women are 11% higher than the group average, while the men are a full 24% higher. Again, if age variation is preferred, then Brazil has a very healthy diversity.
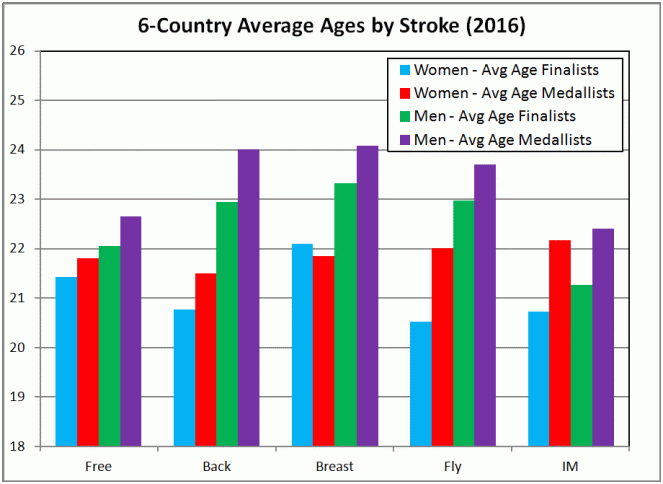
Further Breakdowns
Since I have the data, I decided to break down the average ages further.

Here I grouped the countries together and then looked at sprint (50s and 100s), middle distance (200s), and distance (400s and up). Some might argue with the break downs here, but you get the idea.
The first thing that should grab you is that sprinters are definitely older for all categories. This shouldn’t really surprise people, but it does make it clear that sprinters need to be encourage to stick around for longer. And generally, distance swimmers are younger.
And the next thing that should grab you is the clear indication that medalists are older than finalists in all categories.
OK, one more breakdown.
I wasn’t sure what to expect here. And I’m not sure what I got. It’s pretty much a mishmash, without any clear trends. I’d love to hear any theories about what this means, because I haven’t come up with any!
Summary
The data shows median level for top level women swimmers is 20.4 about a year younger than the men’s median age of 21.5. However, median age does NOT mean peak performance age.
If a country’s swimming performance health is tied to the age variation of its top swimmers, then Brazil is the healthiest of these 6 countries, and Canada is the least healthy.
And, just as everyone already knew, sprinters tend to be the oldest swimmers, while distance swimmers tend to be among the youngest.

Love what you have done here.
I’m surprised more with the last graph where the form strokes are higher than the freestyle but the IM is so low. The form stroke swimmers should possibly be pushed to take up the IM more.
Just a thought.
John Widmer
Sydney. Australia
Great Analysis
Well done
In the now old days of swimming back in the late 60 and 70’s……most of the people I knew were off to work by the age of 19 and 20, once there collegiate careers were done.