

This time up: 200 Butterfly for Men.
The first set of analyses involved the long axis strokes for men and women (here, here and here). We found clear indications of specific race profiles (Sprinter, Distance and Hybrid – see below) that made sense given the efficient nature of the strokes. The women’s freestyle and backstroke were won with Sprinter profiles, while the men’s races were won with Distance profiles.
Our last analysis, the 200 butterfly for women (here) turned that on its ear. In that analysis we found that almost everybody had very similar first 150 strategies, with the race really decided on a wild last 50. We’ll now find out if the same holds true for the men’s 200 fly.
The Data
The data set consists of 24 elite swimmers at the time of the 2012 Olympics. I used the fastest 24 times from the Olympics and the US Olympic Trials. For each swimmer, I used the fastest time they swam during the competition, and not just their last swim. I also knew that I would have to look at more than just raw splits, in order to compare sprinters to more distance-oriented swimmers, and to provide value to non-elite swimmers. As a result, I used their 50 m Personal Bests [PBs] as well. For a few swimmers for which the 50 PB was unavailable or absurdly old, I was able to infer a reasonable 50 PB from their split on a 100.
I introduce the term “offset” to mean a split minus that swimmer’s PB.
Offset 50 = 50 Split minus 50 PB
The Analysis
The analysis is divided into 3 sections.
1) What are the different ways in which the elite 24 swimmers swim the 200? For long axis strokes, it’s more or less divided into those swimmers who are sprint-oriented, endurance-oriented, and in-between. With this analysis we will attempt to determine how the 200 butterfly is swum.
2) How do the top 8 swim the race differently than the other elite 16? And how does the winner swim differently than the rest?
3) Ways in which we can use this data when dealing with our own non-elite swimmers
Race Profiles
In these analyses I refer to race profiles. These profiles describe the pattern of the swimmer’s 50 splits. It’s important to remember that if a swimmer held a constant speed throughout the race, the 1st 50 would be the fastest because of the start (worth roughly 1.5 seconds), and all 50 would have identical splits, as each would include the turn and 50 m of swimming. This is unlike the long axis strokes where the last 50 split would not include the turn. For that reason, the race profile for short axis strokes should have a slower last length when compared to long axis strokes.
For the long axes strokes, I’ve defined the race profiles as follows: a Sprinter Profile is one in which each split is slower than the one before; a Hybrid Profile is one in which the 4th 50 is roughly the same as the 3rd 50; and a Distance Profile is one in which the 4th 50 is noticeably faster than the 3rd 50.
However, long axes strokes are more efficient in the water than the short axes strokes, and we can anticipate that this will cause less fatigue and therefore affect the shape of the profiles. This was certainly true of the women’s 200 butterfly.
Men’s 200 Butterfly Analysis
How do the Elite Swim the 200 Butterfly?
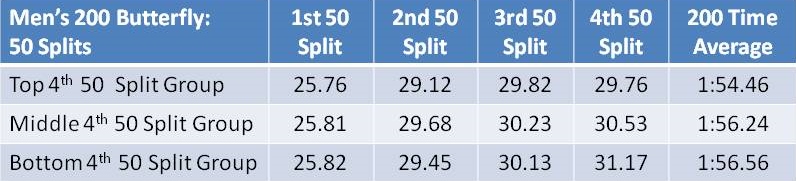
Here we are looking to determine the various race strategies of elite swimmers in the 200 butterfly. My usual tactic is to rank the swimmers in order of their 50 PB, and then put them into 3 groups of 8: the Top group, or fastest 8 PBs , the Middle group, or next fastest 8, and the Bottom group, or slowest 8 BPs. The theory is that the swimmers with the fastest PBs will swim the race as sprinters, while the swimmers with the slowest PBs will swim the race as distance grinders. For the women’s 200 fly analysis we could discern virtually no differences between the three groups. Here we see the exact same thing with the men’s 200 fly.


We can see from the graph and the table that despite significantly different PBs the average 50 splits for the three groups are almost identical. Even the 200 Time averages of these three 50 PB groups aren’t very different. This result matches the women’s analysis. So the next thing I looked at was how all 24 of the swimmers individually swam the race. And here’s the result.
This looks pretty similar to what we saw with the women. Let’s dig into the numbers a little to see how they compare.
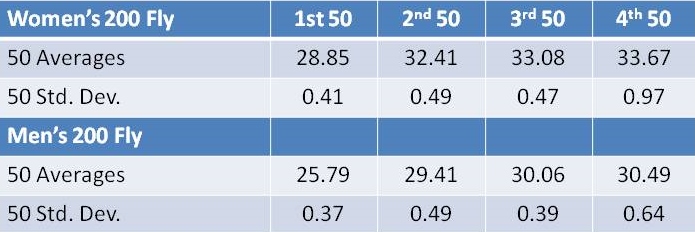
The standard deviations give us a definitive measure of the variations in how the 24 swimmers swam the race. We can see that the first three 50s for both men and women each had fairly small variations, which confirms our visual inspection of the data. The first 150 was generally handled the same by almost everybody. In fact, the average increase in 50 split time from 1st 50 to 2nd 50 is 3.6 seconds for both men and women, and the average increase from 2nd 50 to 3rd 50 is 0.7 seconds for both.
Then we get to the last 50, where we see the women had a huge variation in the 4th 50 split, while the men’s variation increased, but not nearly as much.
If we group the 24 according to where we see the most variation, their 4th 50 split, we get the following. I’ve added the similar curve for the women’s 200 fly as well.
We can see a definite similarity to the women’s results.
Since the men’s and women’s profiles are essentially the same, it appears that we have a common set of Elite 200 Butterfly profiles.
All profiles have a common first 150, consisting of an initial 50 at between 1.0 and 1.5 seconds above their PB, followed by a 2nd 50 at roughly 3.5 seconds slower, and then a 3rd 50 at an additional 0.7 seconds slower. The last 50 is where the races profiles diverge into a Dying profile (last 50 is at least 1 second slower than the 3rd 50), a Fading profile (last 50 is between 0 and 1 second slower than the 3rd 50) and a Finishing profile (last 50 is faster than the 3rd 50).
These highly specific profiles cover almost all of the elite 200 butterfliers.
Why are Best Better Than the Rest?
We’re next going to look at the what the top 8 are doing that makes them better than the other 16 elite swimmers. The best way to do this is to try to identify some specific aspect of the race that the top 8 do differently than the rest. Examples of this aspect could be their 50 PB, 1st 50 split, last 50 split, etc. And to measure the impact of this specific aspect, we’ll group the 24 swimmers into 3 groups of 8 according to this aspect, determine the average 200 time for the Top group, and then compare this Top group 200 average to the 200 time average of the top 8 200 times. The smaller the difference between the two averages, the more important that aspect of race.
The table below shows the results.

From what we saw above, we already knew that the 50 PB was not a good indicator of success, and this table reflects this. As usual, we can see that each of the individual 50 splits are good indicators of final times. In order to drill a bit deeper than previous analyses, I’ve looked at all three groups to determine the best 50. In this case we can see that it’s the third 50. This is a slight difference from the women’s race when the best indicator was the 4th 50.
Here’s the graph when we group by the third 50.
Here we can clearly see that on average, each group used an Fading Profile, with the top 8 being slightly faster for the 2nd, 3rd and 4th 50s. We can see that this is an event where the 1st 50 really isn’t that important.
Now we’ll drill down a bit deeper and try to figure out why Chad Le Clos is the best of the best. For reference purposes, the fastest 8 were also the Olympic finalists. This first graph shows the raw 50 splits for the top 8 swimmers.

Once again, we see an almost identical first 100, with the fun not starting until the 3rd 50 when different strategies were employed. Even then, it all came down to the last 50. We have 2 Finishing profiles (Le Clos and Chen) and only one Dying profile (Stjepanovic). The rest were Fading profiles. If you remember the race, it came down to Le Clos passing and just beating Phelps by 0.05 seconds, with Matsuda another 0.20 seconds back. The way those three swam the last 100 is quite interesting.
Phelps was more of the aggressor, with a small lead at the 100 and 150, but then tired and had the slowest last 50 of the three. Le Clos, on the other hand, was clearly the slowest of the three at the 150 mark, and then came charging back with the fastest last 50 of the field of 24 by almost a half second. Even then, Phelps might still have won if he had timed the last wall better.
This really shows that both the Fading profile and the Finishing profile are potentially winning profiles.
Just for fun, let’s look at the 50 Offsets for the top 8.

We can see that Le Clos was able to swim the finals with the highest offsets until the last 50: yet another example of how a fast 50 PB can be of benefit in a 200. Phelps also had high offsets compared to the rest of the field.
There are three other swimmers within interesting strategies. Tyler Clary, Dinko Jukic and Chen Yin all swam the race with low offsets (and all with relatively slow 50 PBs). Clary started off strong, but then started to fade in the 3rd 50 and died in the last 50 (0.77 above 3rd 50). Jukic was very aggressive through the 150 mark and only faded slightly (0.33 above 3rd 50). And Chen, like women’s winner Liuyang, was aggressive through the 150 and then unleashed an impressive last 50 (lowest 4th 50 offset of the finals). Chen also had the highest 50 PB of the finals as well, so this kind of race was necessary for him to be competitive.
Ways in Which We Can Use This Data
Normally, this section would provide two methods for non-elite swimmers to make use of the data above. However, as with the 200 fly for women, I don’t see how this is possible. When the vast majority of the 24 elite swimmers raced the first 150 in very similar fashion, all sense of race strategies seem to be thrown away. It mainly comes down to how fast you can swim that last 50, and this doesn’t lead to developing useful splits for slower swimmers. In fact, it doesn’t even lead to developing useful splits for elite swimmers.
Summary
The vast majority of the elite men and women swim the 200 butterfly with a strange similarity. The first 150 m involve a first 50 split of between 1.0 and 1.5 above their 50 PB, then a 2nd 50 roughly 3.5 seconds slower, and a 3rd 50 an additional 0.7 slower. The 4th 50 is where we get any kind of significant difference between the elite swimmers. This difference can be represented as race profiles: Dying profile, where the 4th 50 is 1.0 seconds or more slower than the 3rd 50; Fading profile, where the 4th 50 is between 0.0 and 1.0 seconds slower than the 4th 50, and a Finishing profile, where the 4th 50 is faster than the 3rd 50.
The top 8 are differentiated from the rest of the elite swimmers only by being consistently faster than the rest starting with the 2nd 50. Even the top 8 can have a Dying profile, but there are fewer than there are in the other 16 swimmers.
The Olympic champion, Chad Le Clos used a powerful final 50 and a Finishing profile to just out-touch Michael Phelp’s Fading profile.
Next up: 200 Breaststroke
